Population Growth and what it means for you.
Can we sustain our current growth rate? |
The Earths population currently sits at 7, 362, 313,000 est. In this unit we will be looking at how sustainable is the current rate of growth for the Earth, and what this means for future generations.
Inquiry Statement: Population growth is affected by the spread of people, ideas, and innovations in an increasingly global context. Questions: Factual: What are the causes of population growth? Factual: What are the consequences of unchecked population growth? Factual: What historical factors led to population growth? Conceptual: How does the global spread of information, people, and technology create exponential population growth? Debatable: Is the Earth full? |

|
A peek at population!
|
We love to think of solutions!
|
1. The graph
This unit will explore the past and current global population of humans. To get an idea of how unique the current population is you are going to create a line graph that shows the population through time. You may work with one partner. Please be neat (do not start in pen). Regular dates and population intervals should be selected. I would start at your oldest date on the left handed of the x axis and move up in units of 500 years. For the population, your maximum number should reflect the projected population in 2100. You can use this link to find the population for the following dates. All of the dates below should be on your map (estimate where they will be on your graph). Good luck! What was the human global population in: 10 000 BCE 0 CE 1000 CE 1500 CE 1850 CE 1900 CE 1930 CE 1975 CE 2000 CE 2100 CE (Projected) |
Thomas Malthus
The power of population is so superior to the power of the earth to produce subsistence for man, that premature death must in some shape or other visit the human race. The vices of mankind are active and able ministers of depopulation. They are the precursors in the great army of destruction, and often finish the dreadful work themselves. But should they fail in this war of extermination, sickly seasons, epidemics, pestilence, and plague advance in terrific array, and sweep off their thousands and tens of thousands. Should success be still incomplete, gigantic inevitable famine stalks in the rear, and with one mighty blow levels the population with the food of the world.
—Malthus T.R. 1798. An essay on the principle of population. Chapter VII, p61

So what does Malthus think?
Malthus believed that the Earth had a natural carrying capacity, or limit. Carrying capacity is an important concept. Malthus was also aware of the changing technologies of his time, but he still thought that nothing could stop humanity from eventually hitting a limit. Key to Malthus' theory was the fact that he thought people would reproduce endlessly given the ability. It is striking that Malthus was so negative, as the 18th century (1700s) was called the Age of Enlightenment, and philosophers and scientists often thought that human progress was limitless.
Malthus may have only been wrong on the timeline of his "levelling" of the population. However, Malthus' key idea that people will always continue to reproduce given the chance is not true, today. Some modern societies, wealthy ones, are now experiencing negative population growth. Will we hit the Malthusian limit in the future? We will have to wait and see. One thing is for sure, even with a limit to our population, seven billion is a big number and it is only going to get bigger in the coming century.
3. Terminology
For this unit you will be responsible for learning terminology. For example, you will need to know what a Malthusian believes about population. You might also be asked whether a Malthusian growth model is exponential or logistic. It is your job to keep track of these terms for the upcoming test.
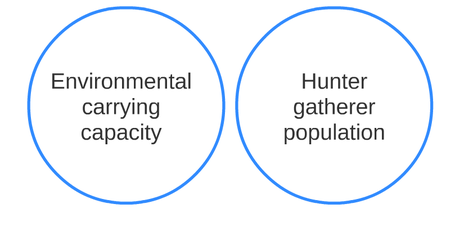
4. Carrying capacity
In ecological terms, the carrying capacity of an ecosystem is the size of the population that can be supported indefinitely upon the available resources and services of that ecosystem. Living within the limits of an ecosystem depends on three factors:
A simple example of carrying capacity is the number of people who could survive in a lifeboat after a shipwreck. Their survival depends on how much food and water they have, how much each person eats and drinks each day, and how many days they are afloat. If the lifeboat made it to an island, how long the people survived would depend upon the food and water supply on the island and how wisely they used it. A small desert island will support far fewer people than a large continent with abundant water and good soil for growing crops.
In this example, food and water are the natural resources of the island. Living within the carrying capacity means using those supplies no faster than they are replenished by the island's environment. A community that is living off the available resources without exceeding them is living within the carrying capacity. A community that is degrading or destroying the ecosystem on which it depends is using up its resources to fast and is living unsustainably (Sustainable Measures). We will return to carrying capacity later in the unit. It is important now to help us understand Malthus' claim about the Earth being unable to support too many people.
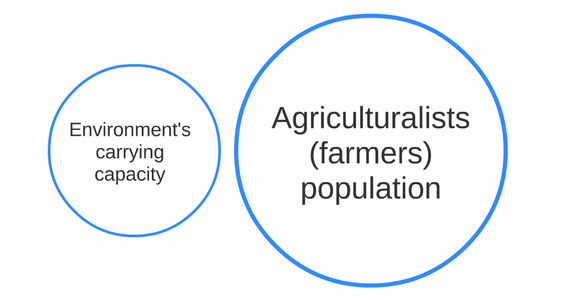
The carrying capacity of the Earth for humans has increased over time, especially with the development of agriculture and other technologies. The Industrial Revolution has only artificially increased our carrying capacity since it is based on the use of fossil resources, and thus is not indefinitely sustainable (Michel Serres Institute).
Malthus believed that the Earth had a natural carrying capacity, or limit. Carrying capacity is an important concept. Malthus was also aware of the changing technologies of his time, but he still thought that nothing could stop humanity from eventually hitting a limit. Key to Malthus' theory was the fact that he thought people would reproduce endlessly given the ability. It is striking that Malthus was so negative, as the 18th century (1700s) was called the Age of Enlightenment, and philosophers and scientists often thought that human progress was limitless.
Malthus may have only been wrong on the timeline of his "levelling" of the population. However, Malthus' key idea that people will always continue to reproduce given the chance is not true, today. Some modern societies, wealthy ones, are now experiencing negative population growth. Will we hit the Malthusian limit in the future? We will have to wait and see. One thing is for sure, even with a limit to our population, seven billion is a big number and it is only going to get bigger in the coming century.
3. Terminology
For this unit you will be responsible for learning terminology. For example, you will need to know what a Malthusian believes about population. You might also be asked whether a Malthusian growth model is exponential or logistic. It is your job to keep track of these terms for the upcoming test.
4. Carrying capacity
In ecological terms, the carrying capacity of an ecosystem is the size of the population that can be supported indefinitely upon the available resources and services of that ecosystem. Living within the limits of an ecosystem depends on three factors:
- the amount of resources available in the ecosystem,
- the size of the population, and
- the amount of resources each individual is consuming.
A simple example of carrying capacity is the number of people who could survive in a lifeboat after a shipwreck. Their survival depends on how much food and water they have, how much each person eats and drinks each day, and how many days they are afloat. If the lifeboat made it to an island, how long the people survived would depend upon the food and water supply on the island and how wisely they used it. A small desert island will support far fewer people than a large continent with abundant water and good soil for growing crops.
In this example, food and water are the natural resources of the island. Living within the carrying capacity means using those supplies no faster than they are replenished by the island's environment. A community that is living off the available resources without exceeding them is living within the carrying capacity. A community that is degrading or destroying the ecosystem on which it depends is using up its resources to fast and is living unsustainably (Sustainable Measures). We will return to carrying capacity later in the unit. It is important now to help us understand Malthus' claim about the Earth being unable to support too many people.
The carrying capacity of the Earth for humans has increased over time, especially with the development of agriculture and other technologies. The Industrial Revolution has only artificially increased our carrying capacity since it is based on the use of fossil resources, and thus is not indefinitely sustainable (Michel Serres Institute).
Technology and carrying capacity
Neolithic Revolution
TASK: Using History Alive! The Ancient World pages 24-39 as a guide, explain how the rise of agriculture in ancient Mesopotamia led to the rise of a complex civilization of Sumer (and larger population).
You will write a 8-10 sentence paragraph with complex sentences.
Or,
Create an infographic (of high quality)
You will write a 8-10 sentence paragraph with complex sentences.
Or,
Create an infographic (of high quality)
| mesopotamia_reading.pdf |
Columbian Exchange
Study skills
TASK: answer the following from the Crash Course
1. What is the Columbian Exchange?
2. Explain what effects the Columbian Exchange had on population growth?
3. Specifically, how was Ireland affected?
4. How is the European use of corn or maize potentially negative?
Annotated timelineTASK: Using Prezi you are going to annotate a digital timeline. You goal is to explain how historical technological innovations and discoveries helped to develop global population. In addition to the Neolithic Revolution and the Columbian Exchange, you need to add the Agricultural Revolution (1500-1800) and theGreen Revolution (21st century).
Before you start you need to collect information on the Agricultural Revolution (1500-1800) and the Green Revolution. Use the attached document to organise yourself.
Use the Prezi below for ideas for your timeline
| population_prezi_research_organizer__1_.docx |
Currently
TASK: Watch Jans Rosling's presentation and answer the following questions.
- What is the gap? Is it still accurate? Explain.
- What does Hans Rosling think about current global population? Is it a problem? Explain.
- What solutions does Rosling propose?
Population pyramids
A population pyramid illustrates the age and sex structure of a country's population and may provide insights about political and social stability, as well as economic development. The population is distributed along the horizontal axis, with males shown on the left and females on the right. The male and female populations are broken down into 5-year age groups represented as horizontal bars along the vertical axis, with the youngest age groups at the bottom and the oldest at the top. The shape of the population pyramid gradually evolves over time based on fertility, mortality, and international migration trends (World Factbook).
A population pyramid illustrates the age and sex structure of a country's population and may provide insights about political and social stability, as well as economic development. The population is distributed along the horizontal axis, with males shown on the left and females on the right. The male and female populations are broken down into 5-year age groups represented as horizontal bars along the vertical axis, with the youngest age groups at the bottom and the oldest at the top. The shape of the population pyramid gradually evolves over time based on fertility, mortality, and international migration trends (World Factbook).
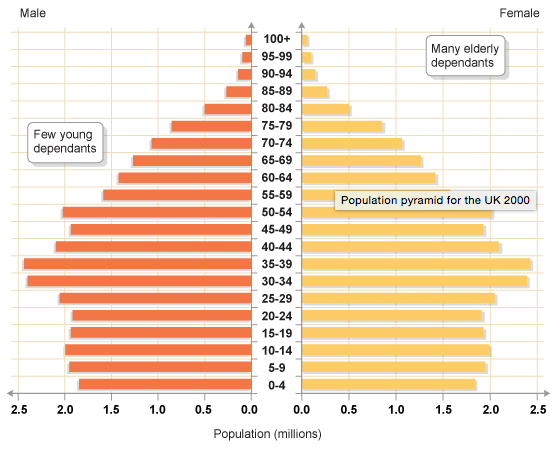
The above graph show the population pyramids of an MEDC (the UK) for 2000. Notice how in the UK 2000 pyramid there is a bulge in the area of the 30-34 and 35-39 age groups, with the numbers thereafter reducing fairly steadily as the ages increase. This matches stage 4 of the demographic transition model.
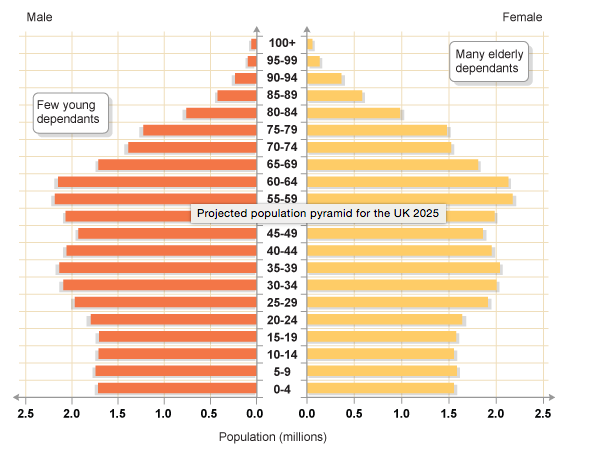
Compare this to the 2025 pyramid, which would be stage 5 in the model. Here the bulge extends much further, covering the age groups 30-64, with the numbers beginning to reduce significantly only after 64.
Analysing population pyramids
Key things to know about population pyramids
Analysing population pyramids
Key things to know about population pyramids
- The shape of a population pyramid can tell us a lot about a country's population.
- It gives us information about birth and death rates as well as life expectancy.
- A population pyramid tells us how many dependants there are. There are two groups of dependants; young dependants (aged below 15) and elderly dependants (aged over 65).
- Dependants rely upon the economically active for economic support.
- Many LEDCs have a high number of young dependants, whilst many MEDCs have a growing number of elderly dependants.
- A population pyramid that is very triangular shows a population with a high number of young dependants and a low life expectancy.
- A population pyramid that has fairly straight sides (more like a barrel) shows a population with a falling birth rate and a rising life expectancy.
- Over time, as a country develops, the shape changes from triangular to barrel-like.
- Places with an ageing population and a very low birth rate would have a structure that looks like an upside-down pyramid.
Task:
| south_korea_population_pyramid.doc |
Population Pyramid Analysis
Hans Rosling believes that global population will peak at 9-11 billion if countries become more developed, women become more educated and have more opportunity, and families start planning to have fewer children. If this is the case we should see evidence of it in population pyramids.
Using the skills from your analysis of South Korea, and the videos provided, you and your group will analyse two additional populations to see if population growth is slowing down. You will present your analysis to the group.
Using the skills from your analysis of South Korea, and the videos provided, you and your group will analyse two additional populations to see if population growth is slowing down. You will present your analysis to the group.
- Your presentation must analyse two assigned population pyramids, the pyramids must be shown in the presentation (use World Factbook)
- In your presentation show a map of your country, name the capital, and state the current population
- It must analyse the reproductive, productive, and post productive sections of the pyramid
- You should place it on the Demographic Transition Model
- Are your countries developed, developing? (LEDC, MEDC)
- Make predictions about its population in the future, is it slowing, shrinking, growing, etc. (most important)
- Check your countries GDP per capita (its global ranking) and its education rates (check expected time in education)
- Are any historical events represented on your pyramid?
